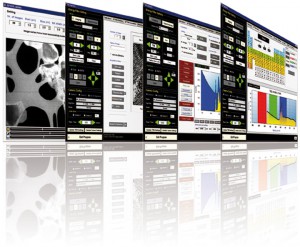
EM-Spectro facilitates acquisition of single images or series and advanced data analysis of energy loss filtered images (EFTEM) and electron energy loss spectra (EELS) operating in TEM or STEM mode. The user friendly interface of EM-Spectro enables an intuitive and comfortable operation in both imaging and spectroscopy mode.
EF(S)TEM-Imaging
- Image acquisition of
- Zero-loss
- Plasmon
- Thickness map
- Series acquisition as function of energy loss (DataCube)
- Automatic (pixel and sub-pixel) alignment of image series by
- Cross correlation function
- Zero-loss images (for each energy loss image a zero-loss image is aquired automatically. Brightness and focus can be individually adjusted.)
- Generation of energy loss spectra from different areas of interest
- Automatic alignment of series acquisition at a fixed energy loss with short exposure time to reduce drift.
- Element mapping methods:
- 2-Windows
- 3-Windows
- White-Line
- Pixel and sub-pixel alignment by the cross correlation function, and zero-loss images.
- Color mapping
- Automatic adjustment of zero-loss peak
- Intuitive calibration procedure
TEM/STEM* - Spectroscopy
- Dual EELS (automatic acquisition of energy low-loss region and core-loss region including auto adjust of electron dosage)
- Spectrum-series acquisition as function of energy loss (long-range energy loss acquisition)
- Spectrum-series acquisition as function of time (in situ experiment for studying the influence of the electron beam on the specimen)
- Fast acquisition speed (up to 8 spectra per second)
- Automatic adjustment of zero-loss peak, so that zero-loss peak is 0 eV.
- Intuitive calibration procedure
- Live spectrum observation to align the zero-loss peak.
- Auto detection of spectra of all dispersions (camera rotation is not needed).
- Fourier filtering (low/high/band-pass)
- Fourier deconvolution (ratio, log)
- Background models: Power law/Shirley/Exponential/Linear
- Derivation, integration, smoothing, Fourier transformation etc.
- Spectra are saved as text files and can be used for post processing with other software.
- Acquisition of drift corrected spectra in STEM mode at defined positions. Points, lines, and rectangle can be defined in STEM image.
- Processing of STEM-EELS DataCube (generating of element map images after background correction).
* Spectra acquisition in STEM mode is carried out for defined positions by the TVIPS Universal Scan Generator (USG).
